Forex Technical Analysis Guide 2026: Trade the Chart, Not the Headlines
Trump just paused Iran strikes for 10 days. China's industrial profits jumped 15.2%. but war risks loom. A cyclone wiped out 8% of global LNG. When the news sends mixed signals every hour, technical analysis is the only anchor that doesn't move.
Exness offers MetaTrader 4 & 5 with full charting suites, 0.0-pip raw spreads, and no restrictions on your strategy. Open an account in under 3 minutes.
Open Exness Account →- → Why TA Matters More Than Ever in 2026
- → Support & Resistance: The Foundation
- → Trend Analysis & Timeframe Selection
- → Candlestick Patterns That Actually Work
- → The 4 Indicators Worth Using (And 3 to Ignore)
- → Confluence: How Professionals Combine Signals
- → Trading Around Geopolitical Events
- → What Traders Are Saying Right Now
- → Best Broker Setup for Technical Trading
Why Technical Analysis Matters More Than Ever in 2026
Friday, March 27, 2026. Before Asian markets opened, three headlines hit simultaneously: Trump paused military strikes on Iranian energy infrastructure for 10 days; China reported industrial profits up 15.2% year-on-year; and Cyclone Narelle disrupted roughly 8% of global LNG supply off Australia's northwest coast. On any given morning, a forex trader who'd built a fundamental thesis the night before would have had it demolished by 6am Belgrade time.
This is the environment you're trading in. Geopolitical noise is relentless. Macro data contradicts itself. Central bank guidance shifts by the week. In this chaos, technical analysis doesn't predict the news, it tells you what price is actually doing regardless of it.
The traders who stayed flat through the Iran headline volatility, then re-entered only when price confirmed direction at key technical levels, banked clean trades. The ones who traded the news directly got chopped. This guide is for the former group.
📌 Key principle: Technical analysis doesn't tell you why price will move. It tells you where it's likely to react. In volatile, news-heavy markets, that edge is priceless.
Support & Resistance: The Foundation
Before indicators, before patterns, before anything else, learn to draw support and resistance levels. Every professional trader does this manually on a clean chart. Here's how:
- 1. Use swing highs and swing lows
Zoom out to the daily or weekly chart. Mark obvious peaks (swing highs) and valleys (swing lows). These are where the majority of institutional orders cluster.
- 2. Zones, not lines
Price doesn't respect exact numbers, it respects zones. A support 'zone' might be 10–15 pips wide. Draw two lines bracketing the area where price has repeatedly reacted.
- 3. Flipped levels
When price breaks through a support level and then pulls back, that old support often becomes new resistance, and vice versa. These 'flipped levels' are the highest-conviction entries in technical trading.
- 4. Round numbers as psychological levels
EUR/USD at 1.0800, USD/JPY at 150.00, Gold at $3,000. Round numbers attract massive option positioning and stop clusters. Always mark them, always respect them.
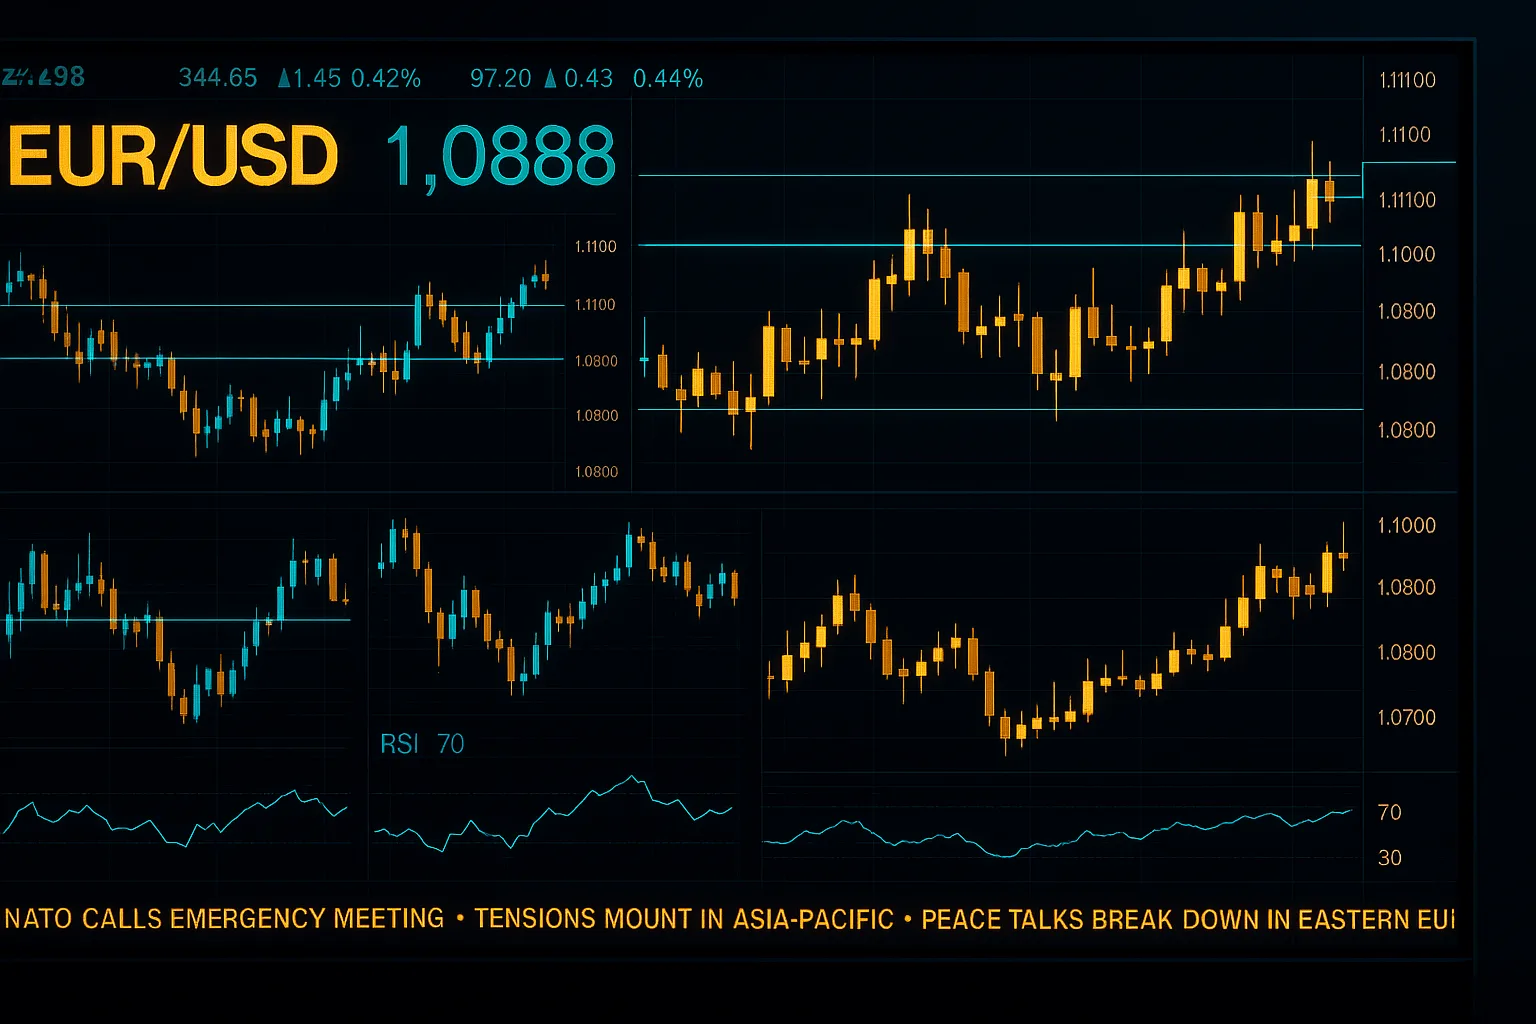
On EUR/USD right now (March 27, 2026), key support sits near 1.0720–1.0740. a zone that held through the USD rally in early March. Key resistance is 1.0850–1.0870. These levels existed before any Trump headline. They'll exist after.
Trend Analysis & Timeframe Selection
The single biggest mistake retail traders make is fighting the trend. "The trend is your friend" is a cliché because it's true, and because almost everyone ignores it in practice.
How to identify the trend: On the daily chart, connect at least 3 swing lows (in an uptrend) or 3 swing highs (in a downtrend). If price is making higher highs and higher lows, it's an uptrend. Lower highs and lower lows: downtrend. Anything else is range-bound, trade differently.
The 3-timeframe approach: Professional traders use three timeframes simultaneously, a higher timeframe for bias (weekly/daily), a medium timeframe for structure (4H/1H), and a lower timeframe for entry (15M/5M). This is called top-down analysis and it's the most effective way to avoid noise.
| Trading Style | Bias TF | Structure TF | Entry TF |
|---|---|---|---|
| Position (days–weeks) | Weekly | Daily | 4H |
| Swing (1–5 days) | Daily | 4H | 1H |
| Intraday (hours) | 4H | 1H | 15M |
| Scalping (minutes) | 1H | 15M | 5M / 1M |
Candlestick Patterns That Actually Work
There are over 100 named candlestick patterns. Most are noise. These 5 carry real predictive value, specifically because of what they tell you about buyer/seller balance at critical price levels:
A large body that completely covers the prior candle. Bearish engulfing at resistance = high-conviction short. Bullish engulfing at support = high-conviction long. Most reliable reversal signal.
Long wick, small body. The long wick shows price tested a level and was violently rejected. A bearish pin bar at resistance is one of the cleanest sell signals in all of technical analysis.
The current candle is entirely within the prior candle's range. Signals consolidation and pending breakout. The direction of the breakout is your trade.
Open and close are nearly identical. total indecision. Alone, it means nothing. At a key level after a strong trend, it signals potential exhaustion. Combine with volume for confirmation.
3-candle reversal pattern. Powerful at major swing points. Evening star at resistance = sell. Morning star at support = buy. Often precedes 100+ pip moves on daily charts.
Single-candle reversal. Hammer at support (long lower wick) = buyers overpowered sellers. Shooting star at resistance (long upper wick) = sellers overpowered buyers.
The 4 Indicators Worth Using (And 3 to Ignore)
Most traders use too many indicators. They create a false sense of confidence and actually reduce signal quality by adding redundant information. Here's the distilled list:
Not for overbought/oversold signals in trending markets (RSI stays above 70 in strong trends, shorting it is a losing game). Use it for divergence: price makes a new high but RSI makes a lower high. That divergence is a genuine warning signal that the trend is losing steam.
The institutional separator. Price above the 200 EMA on the daily chart = macro uptrend. Price below = macro downtrend. Use it as a filter: only take longs when price is above it, shorts when below. Simple, powerful, widely respected.
Not a directional indicator, it measures volatility. Use it to set stop losses and take profits that respect current market conditions. During Iran/Middle East headlines, ATR expands. If EUR/USD's ATR is 80 pips, don't put a 20-pip stop on your trade.
Best used for momentum confirmation, not as a primary signal. When MACD crosses bullish above the signal line at support, it adds weight to your long thesis. When it's already well above zero, don't use it. you're buying late momentum.
Redundant with RSI. Using both gives the illusion of double-confirmation but they move together, you get no new information.
Fine for context, terrible as entries. Price can walk the band in a trend for days. 'Price touched the upper band' is not a sell signal.
The 'golden cross' and 'death cross' lag by weeks. By the time 50/200 EMA cross, the institutional move is already 80% complete.
Confluence: How Professionals Combine Signals
Confluence is the art of stacking independent reasons to be in a trade. The more unrelated signals that agree, the higher the probability. Here's a worked example using EUR/USD right now:
That setup doesn't care about what Trump tweets. If price breaks below the support zone, the setup is invalidated, and you take a small, pre-defined loss. That's the entire discipline.
Trading Around Geopolitical Events: The Technical Edge
Geopolitical events. like this week's Iran pause and China war risk headlines, create specific, tradeable technical behaviors. Understanding the mechanics gives you an edge:
Major headlines cause an initial spike in one direction, followed by a reversal as the market processes the full context. Trump's Iran pause caused a spike in risk appetite, then uncertainty about whether the 10-day window holds. Don't chase the spike, wait for the technical reversal at key levels.
Geopolitical news that breaks over a weekend often creates gaps in currency pairs. Historical data shows 80–85% of gaps below 80 pips eventually fill within 3 sessions. This is mechanical behaviour rooted in market maker liquidity provision.
When geopolitical risk is genuine and escalating, USD, CHF, and JPY tend to strengthen. Gold and oil respond to energy risk specifically. When risk pauses (as with the 10-day Iran window), carry trades and risk-on currencies like AUD and NZD can recover, but only if the broader trend supports it.
When conflicts are resolved or de-escalated, markets often overshoot in the risk-on direction. Position for this with reduced size (uncertainty remains) and wider stops. This is where the 10-day Iran pause is interesting, if it extends to a deal, that's a powerful macro tailwind for EUR/USD and risk currencies.
What Traders Are Saying Right Now
Sentiment from trading communities across Forex forums and social channels this week:
“The Iran headline this morning wiped out my overnight short. Going back to basics, price action only, no fundamentals, until this geopolitical noise settles. Charts don't lie.”
“EUR/USD support at 1.0730 has held now for the 5th time. Either it breaks hard or we bounce 100 pips. Classic squeeze setup. RSI divergence on 4H confirmed. Watching closely.”
“China +15.2% industrial profits sounds bullish but the headline literally says 'war risks threaten outlook' in the same sentence. Market doesn't know which way to price this. TA is your only friend right now.”
“ATR on EURUSD is at 95 pips right now. Stop losses under 50 pips are getting hunted daily. Size down, widen stops, wait for clear levels. This week is not a week to be a hero.”
Community sentiment reflects the reality of trading this week: heightened volatility, competing narratives, and a clear preference among experienced traders for pure price action over fundamental bets.
Best Broker Setup for Technical Trading
Technical analysis is only as good as the execution environment. If your broker has wide spreads, requotes, or slow execution, your technically-perfect setups will lose money mechanically. Here's what matters:
| Broker | EUR/USD Spread | Platform | Best For |
|---|---|---|---|
| Exness ★ | 0.0 pip (Raw) | MT4 / MT5 | All styles incl. scalping |
| IC Markets | 0.0 pip (Raw) | MT4 / MT5 / cTrader | High-volume, cTrader fans |
| Pepperstone | 0.0 pip (Razor) | MT4 / MT5 / cTrader | Swing & position traders |
| XM | 0.1 pip (Ultra Low) | MT4 / MT5 | Beginners, low deposit |
| AvaTrade | 0.9 pip (standard) | MT4 / AvaTradeGO | Regulated, fixed spreads |
For a technical trader, Exness stands out: 0.0-pip raw spreads on EUR/USD and USD/JPY, MetaTrader 4 and 5 with full indicator suite, lightning-fast execution, and no restrictions on scalping or EA strategies. Traders using MetaTrader 5 get 21 timeframes and a faster strategy tester, while those who prefer depth-of-market should check our best cTrader brokers. In volatile geopolitical conditions, the cost differential between 0.0 and 1.0 pip spread becomes material fast, especially if you're making 10–20 entries per week.
Ready to Put This Into Practice?
Start with a demo account to test your technical setups risk-free, then switch to live when you're consistently profitable. Exness offers both, with the same 0.0-pip spreads on demo and live.
Start Trading with Exness →74–89% of retail CFD accounts lose money. Only trade capital you can afford to lose.
James has traded currencies professionally for 11 years, with a focus on technical price action across major and minor pairs. He covers broker reviews, market analysis, and trading education for forex.mobile.
Recommended Brokers
All brokers independently reviewed and tested by our team.